Feature scaling is an essential part of any machine learning pipeline. In the process of designing our own neural networks designed to interpret EGMs, we have tested various scaling functions on real data, and we present the results below.
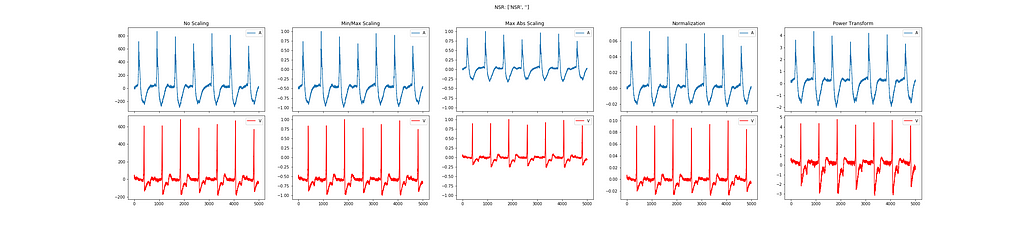
No Scaling — This retains the data in its raw format.
Min-Max Scaling — This function scales the maximum value to be 1, and the minimum value to be -1.
Max Abs Scaling — This function scales the maximum absolute value to be either 1 or -1.
Normalization —This function takes the L2 norm of the sample.
Power Transformation — Applies a monotonic transformation to the data. Monotonicity means that the function is always increasing, or always decreasing. In this case, the Yeo-Johnson method is used.
There are a few qualities we’re looking for in a good scaling algorithm.
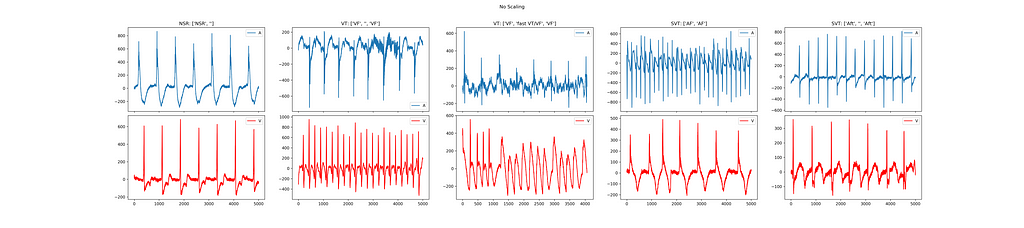
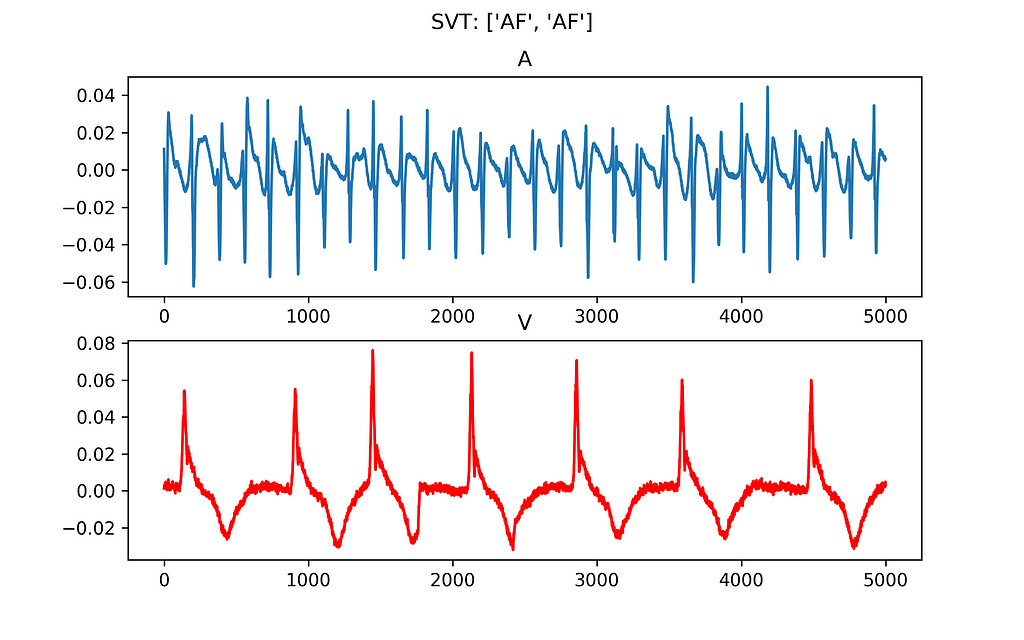
This is our baseline moving forward. The blue channel is a recording from the atrium of the heart, and the red is from the ventricle. The signals above are the original unscaled signals representing five conditions the heart is in. NSR means Normal Sinus Rhythm. VT stands for Ventricular Tachycardia, VF for Ventricular Fibrillation. VT and VF are potentially lethal. SVTs are a category of arrhythmia called Supraventricular Tachycardia. You can read more about them here. AF is Atrial Fibrillation and Aft is Atrial Flutter. SVTs are generally non-lethal.
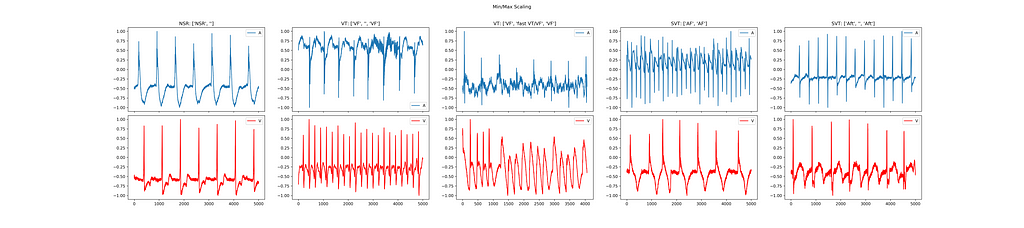
The Min Max scaled signals are not centered around zero. Not only are the signals not centered around zero, they aren’t even centered around a consistent value. The center is -0.5 for the atrial channel in the NSR electrogram. In the Atrial Fibrillation example’s atrial channel, the zero is around 0.25. This variability is not what we’re looking for in preprocessing data.
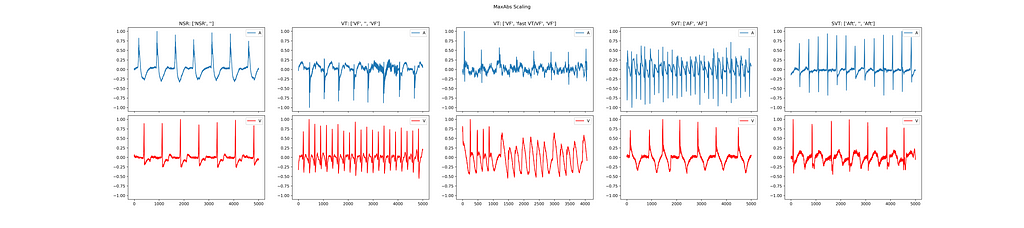
This transformation, while following the same basic format of Min Max scaling, fares considerably better. Because it only modifies the maximum absolute value to be one or negative one, it preserves the center around zero. The application of a single scalar also means the shape of the signal is preserved. It does well on our three goals, ensuring that the signal is within the same range, that features are preserved, and turns different episodes into signals with similar characteristics.
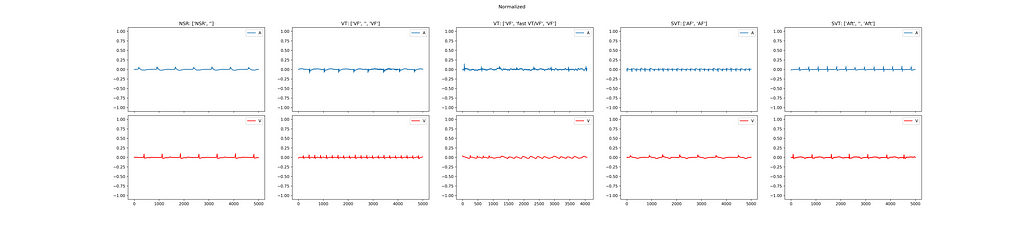
Normalization isn’t usually applied to time-series data sets, but I thought it’d be interesting to see how it performed. As you can see, it does an interesting job. The figure on the left shows us some more detail. This transformation is similar to the MaxAbs transform, in that it preserves the center and shape of the data. Unfortunately, the magnitude of the signal is so small that changes are barely noticable. This scaling method doesn’t perform well at keeping features apparent due to its magnitude issues.
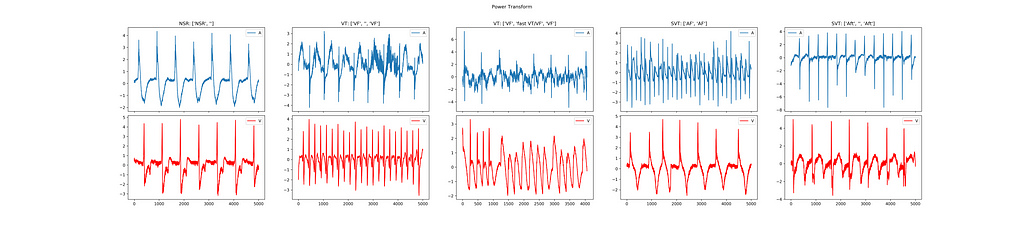
The power transform changes the shape of the signals. The best example of this is in the Normal Sinus Rhythm’s ventricular channel. The power transform magnifies the negative peaks of the signal. This could be very helpful in magnifying details that could be missed. Another benefit is that the signals appear to be centered around zero.
On the other hand, the signals are not bound by the same values. The max value ranges from 3 to 6. Perhaps applying MaxAbs scaling could turn this into a particularly powerful transformation.
It seems that Min Max Scaling and Normalization don’t perform well at all. The Power Transformation has interesting qualities, but doesn’t stand well on its own. The Max Abs scaling method, while very simple, provides all of the qualities we’re looking for.
<hr><p>Feature Scaling in Real Cardiac Electrograms was originally published in Medical CPS on Medium, where people are continuing the conversation by highlighting and responding to this story.</p>